iDempiere’s powerful reporting system allows users to organize, present, and analyze data with ease, and one of the essential features of this system is Data Tables. These tables present detailed, structured information in a clear, tabular format, enabling businesses to view important data at a glance.
While Pivot tables allow you to aggregate data, data tables will enable you to browse data quickly (sort, filter, etc…)
Table of contents
What Are Data Tables?
Data tables are used in iDempiere reports to display rows and columns of data in an organized manner. They provide insights into business operations, performance metrics, and financial details. Whether reviewing sales orders, tracking inventory, or analyzing customer information, data tables allow you to present your data cleanly and effectively.
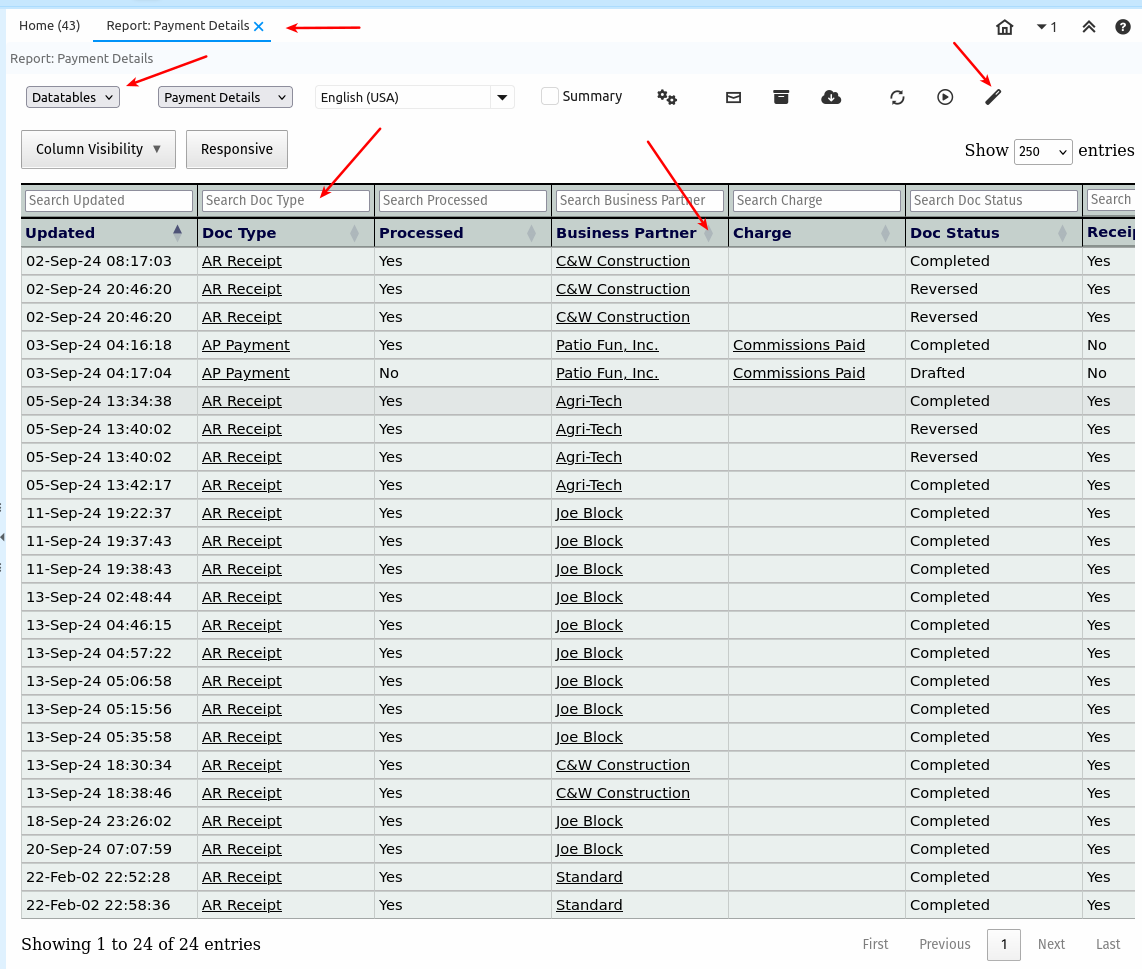
The 5 main benefits you gain from data tables are:
- Pagination
- Instant search
- Ordering
- Column visibility
- Responsiveness
Key Features of Data Tables in iDempiere
- Sorting and Filtering: You can easily sort and filter data in real-time to get a clearer view of specific metrics.
- Grouping Data*: iDempiere allows users to group data by various categories, such as customer, product, or region, enabling quicker analysis of segmented information.
- Drill-Down Capabilities*: Clicking on data in a table often allows you to drill down into more detailed records, providing deeper insights.
- Customizable Columns: Users can choose which columns they want to display, enabling them to tailor reports to specific needs.
* iDempiere reports come standard with the ability to group data and drill down into more detailed records, providing deeper insights. This functionality is not exclusive to data tables but is an integral feature of the iDempiere reporting tool, allowing users to explore underlying data across the system seamlessly.
How to use Data Tables in iDempiere
- Open the report: Navigate to any report that contains the data you want to analyze.
- Choose Data Table Mode: In the top left dropdown, select Datatables mode.
- Design the Table Layout: Organize columns, apply sorting, and configure filters.
Why Use Data Tables in iDempiere?
Data tables make it easier to analyze large sets of information in a streamlined, easy-to-digest format. They support decision-making by allowing users to compare metrics, view trends, and detect issues.
Ready to Get Started?
Data tables are an integral part of iDempiere’s reporting functionality, offering businesses a flexible and efficient way to view, analyze, and act on data. By leveraging data tables, users can gain clearer insights, make informed decisions, and enhance overall productivity. If you’re ready to take full advantage of this feature, start experimenting with data tables in your iDempiere system today!
You can start exploring Datatables in iDempiere today in one of our test servers. Do you have further questions? Join our community forums to share your experiences and learn from other users.
For more details, visit the technical documentation here.

I am a systems engineer with a great passion for open source, software development, and technology in general. I have been part of the iDempiere community since 2012. I believe the enterprise world is one of the most aggressive environments out there. Companies tend to ruthlessly compete against each other. That is why seeing competitors co-exist and cooperate in harmony in iDempiere (and OSS communities in general) is so interesting to me.
